Streamsets Data Collector log shipping and analysis using ElasticSearch, Kibana and... the Streamsets Data Collector
One common use case scenario for the Streamsets Data Collector (SDC) is the log shipping to some system, like ElasticSearch, for real-time analysis. To build a pipeline for this particular purpose in SDC is really simple and fast and doesn't require coding at all. For this quick tutorial I will use the SDC logs as example. The log data will be shipped to Elasticsearch and then visualized through a Kibana dashboard. Basic knowledge of SDC, Elasticsearch and Kibana is required for a better understanding of this post.
These are the releases I am referring to for each system involved in this tutorial:
<timestamp> [user:<username>] [pipeline:<pipeline_name>] [thread:<thread_name>] <log_level> <class_name> <message_separator> <message>
So a possible Grok pattern to use for it could be the following:
Please notice that there are 2 spaces between the log level and the class name.
Run the following command then to verify that the index has been successfully created:
Select, of course, Elasticsearch as destination and set up the following properties for it in the Elasticsearch tab:
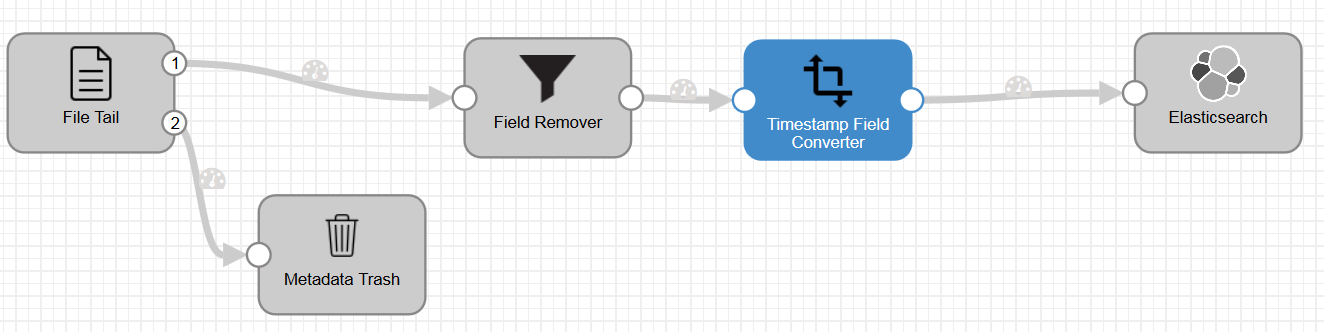
You could choose to discard some of the fields in the original records, like the message separator, that are meaningless in terms of log analysis. Use a Field Remover processor to do this.
Finally, before sending the records to the final destination, you need to convert the timestamp in a format suitable for Elasticsearch. Using a Field Converter processor you can change the type of the timestamp field to DATETIME using the yyyy-MM-dd HH:mm:ss date format.
Now you can connect all of the blocks in the pipeline and at the end you should have something like this:


Now you can perform any search and setup a custom dashboard for them.
These are the releases I am referring to for each system involved in this tutorial:
- JDK 8
- Streamsets Data Collector 1.4.0
- ElasticSearch 2.3.3
- Kibana 4.5.1
Elasticsearch and Kibana installation
You should have your Elasticsearch cluster installed and configured and a Kibana instance pointing to that cluster in order to go on with this tutorial. Please refer to the official documentation for these two products in order to complete their installation (if you don't have already done it).Streamsets Data Collector set up
You need then a single instance SDC (no need to run a cluster for this particular scenario) up and running as a service. Please follow the instructions in the official documentation if this is the first time you do this.SDC logs pattern
The logs produced by SDC have their own specific pattern that doesn't fall into one of the structured formats (common, combined, Apache error and access, log4j) provided by the product for log files. So the best way to parse them is to use a Grok expression. A typical line of a SDC log file follows this pattern:<timestamp> [user:<username>] [pipeline:<pipeline_name>] [thread:<thread_name>] <log_level> <class_name> <message_separator> <message>
So a possible Grok pattern to use for it could be the following:
%{TIMESTAMP_ISO8601:timestamp} %{DATA:user} %{DATA:pipeline} %{DATA:thread} %{LOGLEVEL: level} %{WORD:class} %{DATA:sep} %{GREEDYDATA:message}Please notice that there are 2 spaces between the log level and the class name.
Create an index on Elasticsearch
Now that we know the pattern of the logs to ship we can create an index for them in Elasticsearch:curl -XPUT 'http://<es_host>:<es_port>/sdclogs' -d '{
"mappings": {
"logs" : {
"properties" : {
"timestamp": {"type": "date"},
"level": {"type": "string"},
"message": {"type": "string"},
"user": {"type": "string"},
"pipeline": {"type": "string"},
"class": {"type": "string"}
}
}
}
}' Run the following command then to verify that the index has been successfully created:
curl -XHEAD -i 'http://<es_host>:<es_port>/sdclogs'Pipeline creation
Connect to the SDC UI as administrator and create a new empty pipeline. Then select an origin for the data. My suggestion is to use the File Tail origin rather than the Directory origin because in this second option if for some reason a log line doesn't match the selected Grok pattern the whole file will be skipped, while in the first option only the single log entry will be sent to the error bin and the parse of the log(s) file in the selected path will go on any way. This is the list of properties to set up for the origin in the Files tab:- Data Format: Log
- File to Tail:
- Path: $SDC_LOGS_DIR/${PATTERN}
- Pattern: a regular expression to get the SDC logs only.
- Log Format: Grok Pattern
- Grok Pattern: %{TIMESTAMP_ISO8601:timestamp} %{DATA:user} %{DATA:pipeline} %{DATA:thread} %{LOGLEVEL: level} %{WORD:class} %{DATA:sep} %{GREEDYDATA:message}
Select, of course, Elasticsearch as destination and set up the following properties for it in the Elasticsearch tab:
- Cluster Name: the name of your Elasticsearch cluster.
- Cluster URIs: a comma-separated list of host:port pairs for one or more nodes of your cluster. For this property you have to specify the Elasticsearch transport protocol port (which by default is set to 9300), not its HTTP APIs port.
- Cluster HTTP URI: the host:port pair to connect via HTTP to your Elasticsearch cluster (the same values you used to create the index previously).
- Index: the name of the index created previously.
- Mappings: the name of the mappings for the index to use. In the example above it is logs.
You could choose to discard some of the fields in the original records, like the message separator, that are meaningless in terms of log analysis. Use a Field Remover processor to do this.
Finally, before sending the records to the final destination, you need to convert the timestamp in a format suitable for Elasticsearch. Using a Field Converter processor you can change the type of the timestamp field to DATETIME using the yyyy-MM-dd HH:mm:ss date format.
Now you can connect all of the blocks in the pipeline and at the end you should have something like this:
Running the pipeline
Start the pipeline and check for the data quality through the dedicated widgets.Set up Kibana to explore the data
Connect to the Kibana UI and then configure the Elasticsearch index pattern to perform search and analytics. Move to the Settings -> Indexes section, specify the index name (sdclogs) and click on the Create button. Then move to the Discover section, select the sdclogs index and have a look at the data:
Now you can perform any search and setup a custom dashboard for them.
Comments
Post a Comment